This is the second blog on Azure E2E monitoring and its features. In this blog, we will deep dive and explore some of the cool features related to network performance monitoring, aka Network Performance Monitor (NPM). One of the essential features, such as ExpressRoute monitoring, is now possible in NPM.
Based on my experience, I have come up with the following summary of the capabilities of NPM (Network Performance Monitor). NPM is used to help detect network issues like traffic blocking, routing errors, and also detect issues that the other NPM solutions failed to identify.
This blog will explain the concept of the Express route, its benefits, and its capabilities. We will also clarify why to use it and how easy it is to use.
Extend your on-premises networks into the Microsoft cloud over a private connection facilitated by a connectivity supplier only through ExpressRoute. You can also establish connections to Microsoft cloud services, such as Microsoft Azure and Office 365.
Azure ExpressRoute is used to create private connections between Azure datacenters and infrastructure on-premises or in a co-location environment. Users need to be mindful that ExpressRoute connections do not go over the public Internet. ExpressRoute offers faster speeds, lower latencies, and more reliable as compared to typical public internet connections. As per experience in some use cases, using the ExpressRoute connection to transfer data between on-premises systems and Azure can give clients significant cost benefits as well.
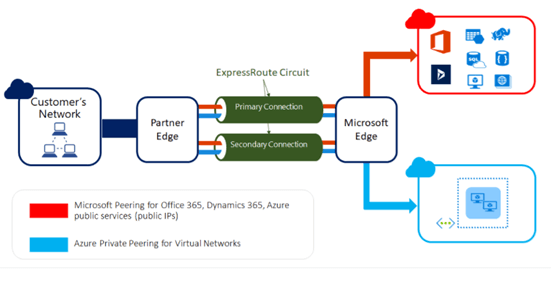
In the picture below, you can see how a customer network connects with the ExpressRoute circuit on primary and secondary connection, and on the other side, it is connected to Microsoft peering on public IPs and Azure private peering for a Virtual network.

Advantages
- Integrate with Azure for a true Public/Private Hybrid solution
- Private connections to Azure environment
- Improved reliability and speed
- Unified connectivity to all Microsoft Cloud Services
- Lesser latency and higher security
- Reduced costs by taking advantage of lower transfer rates
Network Performance Monitor (NPM)
Let us understand the concept of Network Performance Monitor (NPM). NPM is a cloud-based hybrid network monitoring solution that helps the user to monitor network performance between various points, such as network infrastructure, network connectivity to service, or application endpoints. Most importantly, it helps you monitor the performance of your Azure ExpressRoute.
With NPM’s Performance Monitor, you can:
- Autodetect ExpressRoute circuits associated with your subscription
- Track bandwidth utilization, loss, and latency at the circuit peering, and Azure Virtual Network level for ExpressRoute
- Discover network topology of your ExpressRoute circuits
How to monitor connectivity to Azure VNets via Express route?
Azure Virtual Network (VNet) is the central building block for your private network in Azure. VNet enables many types of Azure resources, such as Azure Virtual Machines (VM), to safely communicate with each other, the Internet, and on-premises networks. VNet brings with it additional benefits of Azure’s infrastructure, such as availability, scale, and isolation.
How can end to end visibility get in your express route connections?
It is generally observed that on your Azure workload, it is difficult to address or identify the bottleneck of latency since the Express route connection has various components. Components include an on-premise network, ExpressRoute circuits, local edges routers, VNets, public peering, O36 5 services, and ISPs.
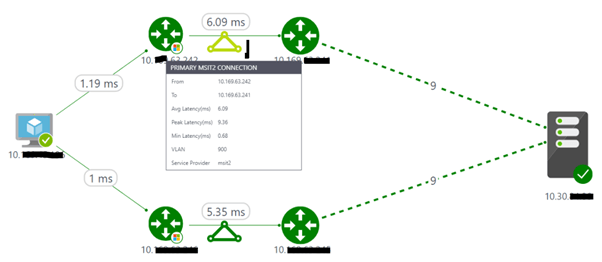
With the help of the NPM interactive topology view, you can get E2E visibility view components and also latency contributed by each hop to identify the troubled segment. As an application business owner, one always wants to know where and what is the issue so it can be identified and rectified as soon as possible.
The image below provides a quick view of topology illustration of where and how the Azure VM on the left is connected to on-Perm VM and use Primary /Secondary connections of EXPRESSROUTE. In summary, nine on-premises hops (shown by dashed lines) are initially compressed.

You can expand the map and choose to view all on-premises hops to understand the latency that occurred in each hop.
NPM helps to diagnose many circuit connectivity issues. Some recent issues that I would like to point out here are as follows:
The circuit is down, or there is degradation of performance due to peak utilization, or sometimes traffic is not flowing smoothly through the primary circuit at all.
As soon as your On-prem resource and your VNET connectivity are lost, you will get a notification. This helps you to take quick, proactive action before any tickets are raised, or end-users escalation happens.
In the illustration below, red marks are unidentified networks and are not passing through any circuits.

Based on my experience, this usually happens in a network that has traffic routing issues and could be because the primary circuit is down, and you set it to automatic routing of traffic, start via the backup route. This is typically termed as traffic, not following the intended route. If this automatic routing occurs well and good, but if it is manual, then it leads to downtime. With NPM, you can now set an alert and proactively address your configuration issue to resolve.

An alert like the one given in the picture helps to understand bandwidth utilization on each VNET.
Similarly, you can get details on PM (Performance Monitor) and SEM (service end monitor) details with these features. To know more about the E2E monitoring of MS Azure, get in touch with the YASH advisory and cloud service team today.
Image credit: MS Azure.
Get more than what you think with YASH Cloud Services.


